
This page documents two related presentations, given four years apart, that together trace the development of real-data CDF experiments combining IASI and GOME-2 ozone profiles.
| Presentation | Conference | Authors | Slides |
|---|---|---|---|
| Data Fusion of IASI and GOME-2 measurements | IASI 2021, 6–10 December 2021, Evian, France | N. Zoppetti, S. Ceccherini, U. Cortesi | Google Slides |
| Data Fusion of MIPAS, IASI and GOME-2 measurements | 13th Atmospheric Limb Workshop, 2–6 June 2025, Karlsruhe, Germany | N. Zoppetti, S. Ceccherini, P. Raspollini, U. Cortesi, L. Guidetti | bit.ly/457GMAU |
Overview
These two studies apply the Complete Data Fusion algorithm to real ozone profile measurements from satellite instruments with complementary viewing geometries, focusing on the synergy between the nadir instruments IASI (TIR, Metop) and GOME-2 (UV, Metop). The first study (2021) is an exploratory case study on a single day of collocated measurements near Florence. The second study (2025) extends the analysis by adding the limb instrument MIPAS (Envisat) and conducting a systematic, multi-year comparison of different fusion configurations.
The two studies are directly connected: the IASI+GOME-2 experiments carried out in 2021 laid the groundwork for the three-instrument comparison in 2025, and the MIPAS+IASI configuration explored in 2025 was subsequently taken to production scale in the PhD project of L. Guidetti (see Guidetti et al., 2026).
Part 1 — First real-data experiments: IASI and GOME-2 (2021)
This exploratory study applies CDF to a single day of coincident IASI and GOME-2 measurements (October 18, 2021) over central Italy. Three IASI profiles and twelve GOME-2 profiles were available in a common geographic area near Florence, providing a 3+1 and 12+3 fusion configuration respectively. The IASI products were FORLI-O3 from the EUMETSAT Combined Products; the GOME-2 products were the offline high-resolution ozone profiles from AC-SAF.
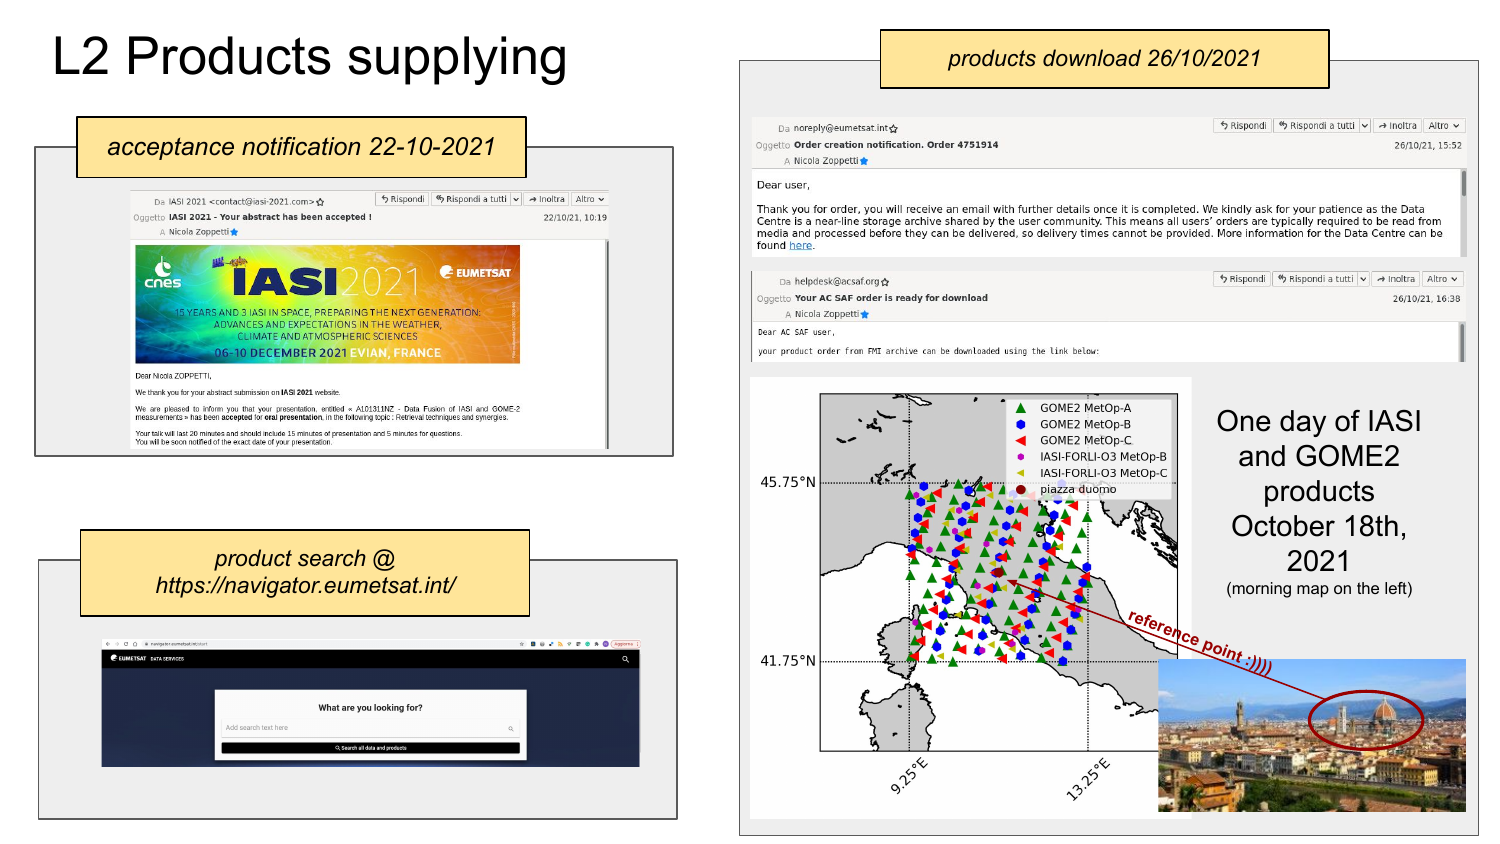
One day of IASI and GOME-2 ozone products (October 18, 2021, morning pass) used in the case study. Left: the download confirmation and data access workflow. Right: geographic distribution of the 15 L2 products (~50 km search radius for 3+1 configuration, ~100 km for 12+3).
Auto-consistency tests
Before any fusion, the auto-consistency test was applied to both input datasets — GOME-2 (AC-SAF) and IASI (FORLI). The test consists of applying CDF to a single product using its own a priori, so that the fused output should be identical to the input. Deviations indicate inconsistencies in the error characterization. The results showed that:
- GOME-2: the test revealed that the original CDF(2015) formula produced large deviations due to the near-singularity of the noise covariance matrix Sn. The new CDF formulation (then under development, subsequently published as CDF(2022)) passed the test cleanly.
- IASI: both formulations passed, consistent with the full-rank structure of the IASI product.
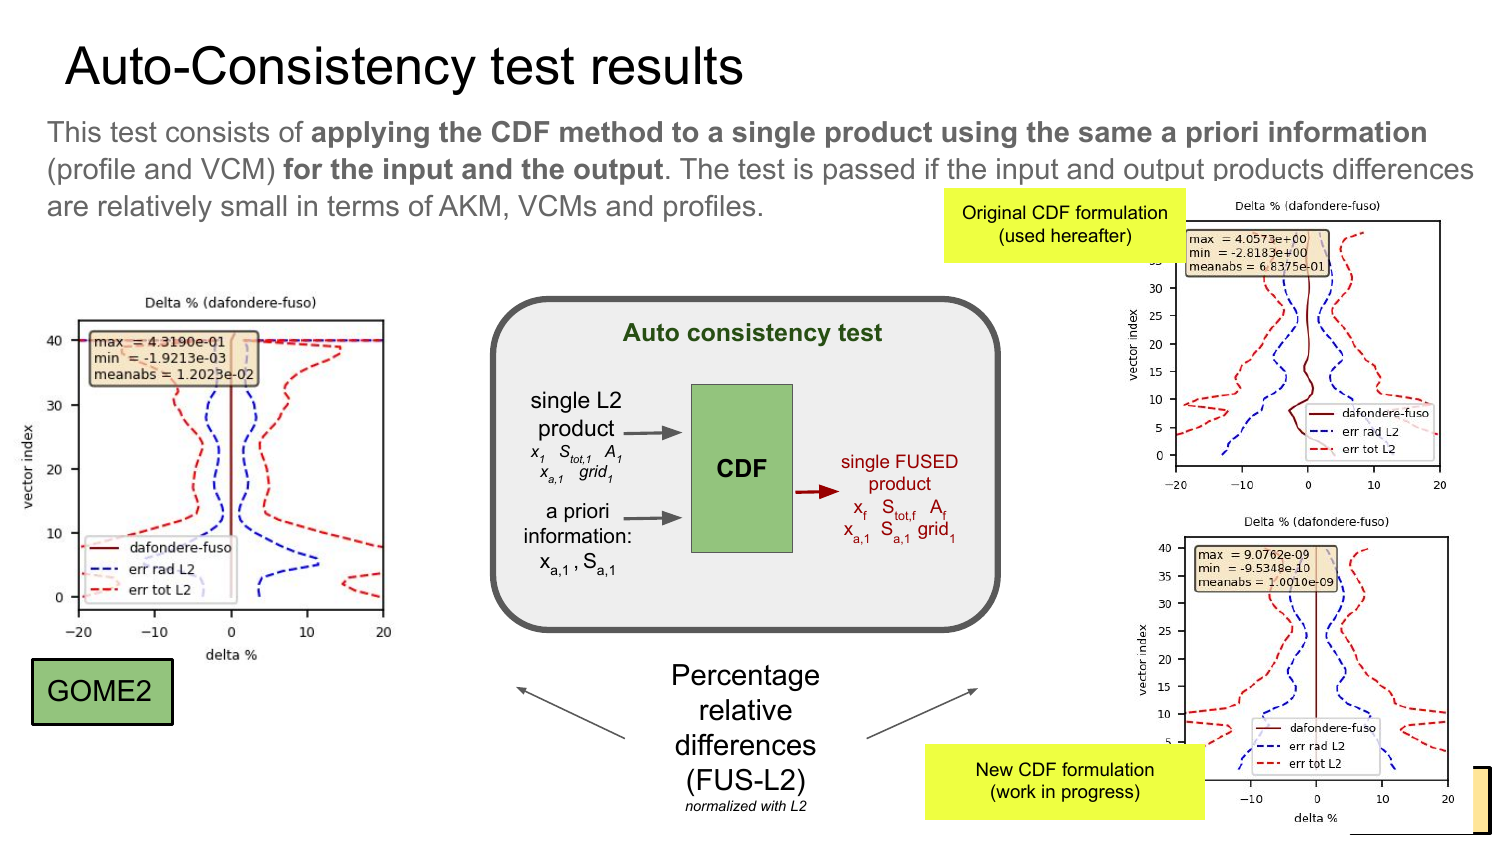
Auto-consistency test results for GOME-2. Left: percentage relative differences (fused minus input). Top right: CDF(2015) — large deviations indicate failure. Bottom right: new CDF formulation (CDF(2022)) — differences are negligible. This result directly motivated the publication of the improved formula.
Grid and a priori change
Because GOME-2 and IASI are defined on different vertical grids and use different a priori information, a direct comparison of their products is not meaningful. The CDF algorithm can be used — applied to a single product — to reproject it onto a different grid and replace its a priori, without adding any new measurement information. This step made the two datasets fully comparable before the fusion.
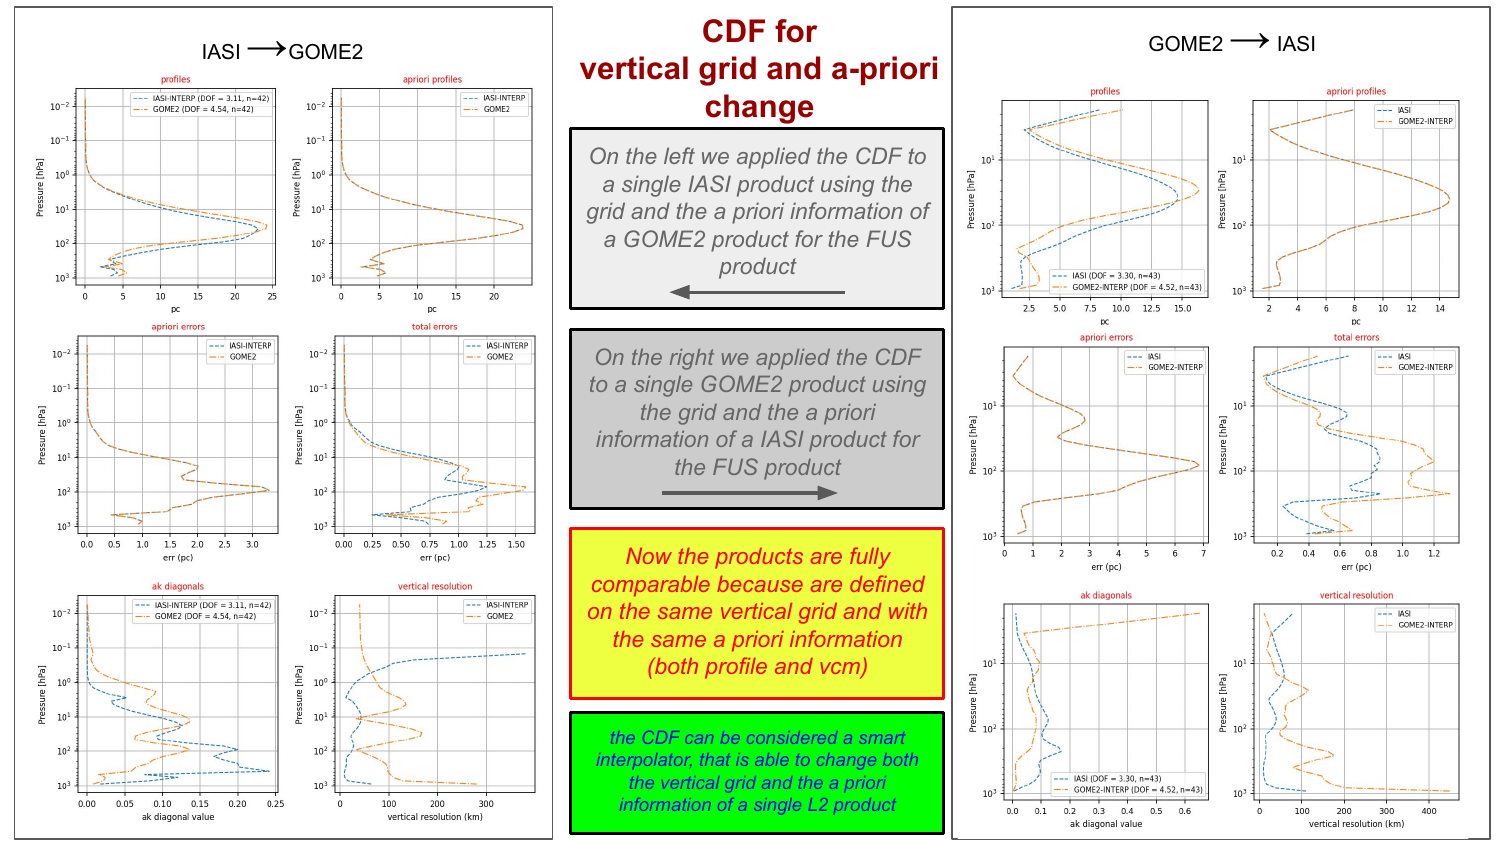
CDF applied to a single product for grid and a priori change. Left: one IASI profile reprojected onto the GOME-2 grid. Right: one GOME-2 profile reprojected onto the IASI grid. After this step, both products share the same vertical grid and a priori, making the multi-instrument fusion directly comparable.
Mono-type and multi-instrument fusion results
Two types of fusion were computed: mono-type fusion (fusing all profiles from the same instrument into a single product, equivalent to producing a regridded L3 product) and multi-instrument fusion (combining profiles from both instruments). In all cases the fused product showed higher DOFs and lower total errors than any individual input. The 12+3 multi-instrument fusion (12 GOME-2 + 3 IASI products, on the GOME-2 grid and with GOME-2 a priori) yielded the most informative result.
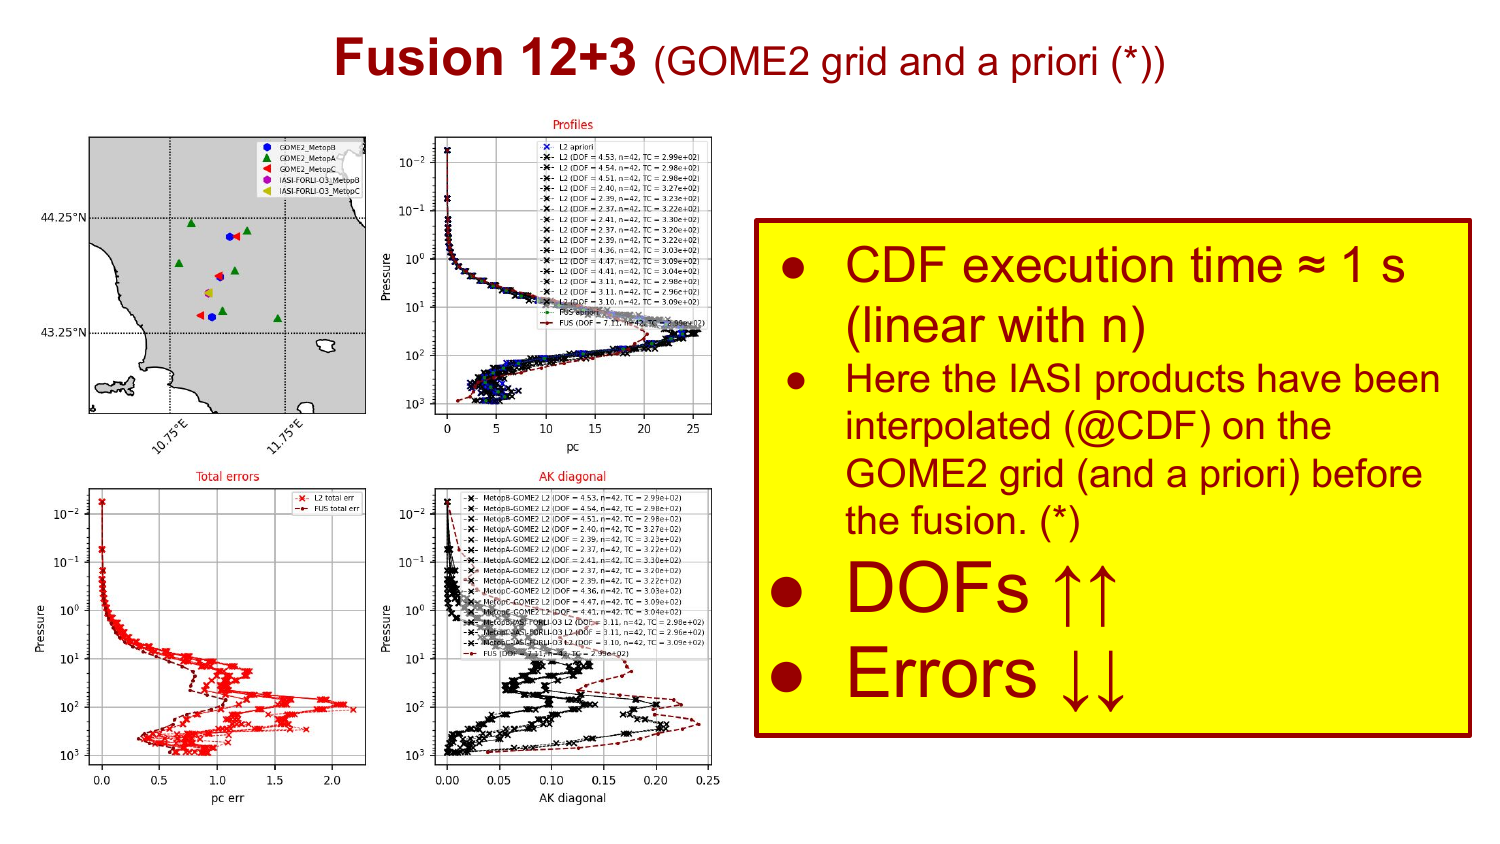
Fusion 12+3 (GOME-2 grid and a priori): profiles (top left), total errors (bottom left), and AK diagonal (bottom right) for all 15 input products and the fused product. DOFs increase and total errors decrease relative to all inputs. The IASI products were reprojected onto the GOME-2 grid before the fusion using the grid-change step described above.
Key observation: When CDF is applied to products of different types (IASI and GOME-2), elements of the state vector that are measured by only one instrument also benefit from the fusion. This quality improvement is propagated through the off-diagonal correlations in the error covariance matrices — a direct consequence of the CDF formulation rather than a post-processing artefact.
Part 2 — Systematic comparison with MIPAS: three-instrument fusion (2025)
The 2025 study adds the limb instrument MIPAS (Envisat) to the IASI+GOME-2 combination and extends the analysis over a four-year period (2008–2011), covering the overlap between the MIPAS mission and the first Metop satellite. Two fusion configurations are compared — MIPAS+IASI and MIPAS+GOME-2 — with the goal of characterizing the improvement achievable in the troposphere and lower stratosphere, where the limb–nadir synergy is expected to be most beneficial. For the MIPAS+IASI configuration, the study includes full validation against independent reference measurements; the MIPAS+GOME-2 comparison is exploratory and identifies directions for a dedicated future study.
Input data
The three input datasets cover a common observation period of 2008–2011 (the overlap between the MIPAS mission and the first Metop satellite):
| Instrument | Platform | Geometry | Product / Provider | DOFs (typical) |
|---|---|---|---|---|
| MIPAS | Envisat | Limb | Custom OE retrievals — IFAC-CNR | ~24.6 |
| GOME-2 | Metop-A | Nadir (UV) | Offline high-res OHP — AC-SAF | ~5.0 |
| IASI | Metop-A | Nadir (TIR) | FORLI-O3 — AERIS | ~2.8 |
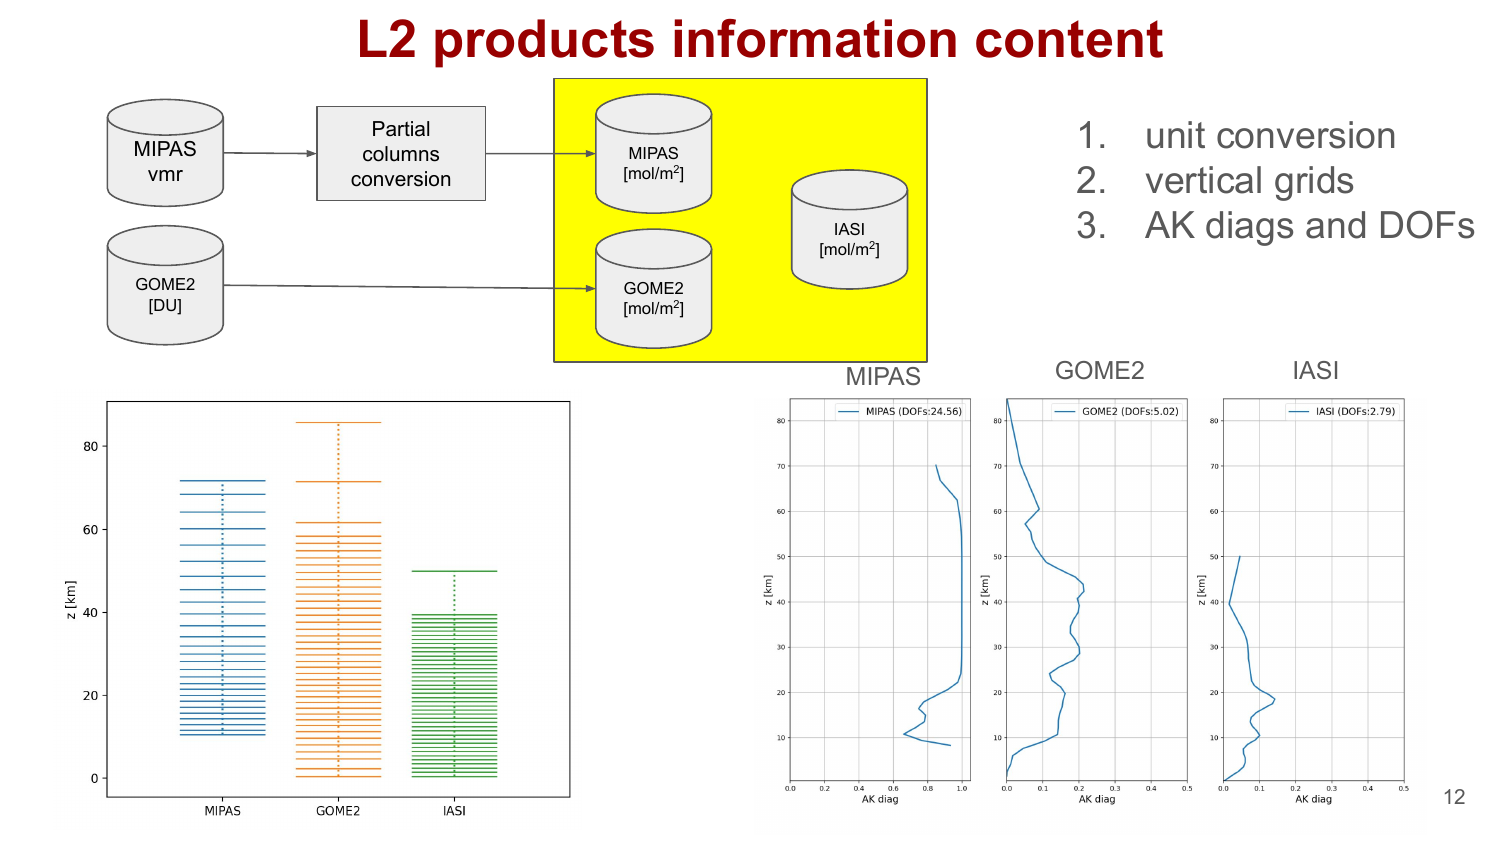
Vertical grids (left) and AK diagonal profiles (right) for MIPAS (~24.6 DOFs), GOME-2 (~5.0 DOFs) and IASI (~2.8 DOFs). MIPAS provides high vertical resolution across the stratosphere; GOME-2 and IASI have coarser sensitivity concentrated in the troposphere and lower stratosphere.
Methods
The CDF algorithm is used in two complementary ways:
- Instrument synergy — direct fusion of coincident measurements: MIPAS+IASI, MIPAS+GOME-2, and MIPAS+GOME-2+IASI.
- A priori and grid change — used to bring GOME-2 onto the IASI grid and a priori before comparing the two fusion configurations on a common reference.
For all fused products the IASI vertical grid and IASI a priori are adopted as references, ensuring direct comparability across configurations. Nine strategies for modelling interpolation and coincidence errors were tested on 2008 data; the best-performing configuration (v05) was then applied to 2009–2011 for independent validation.
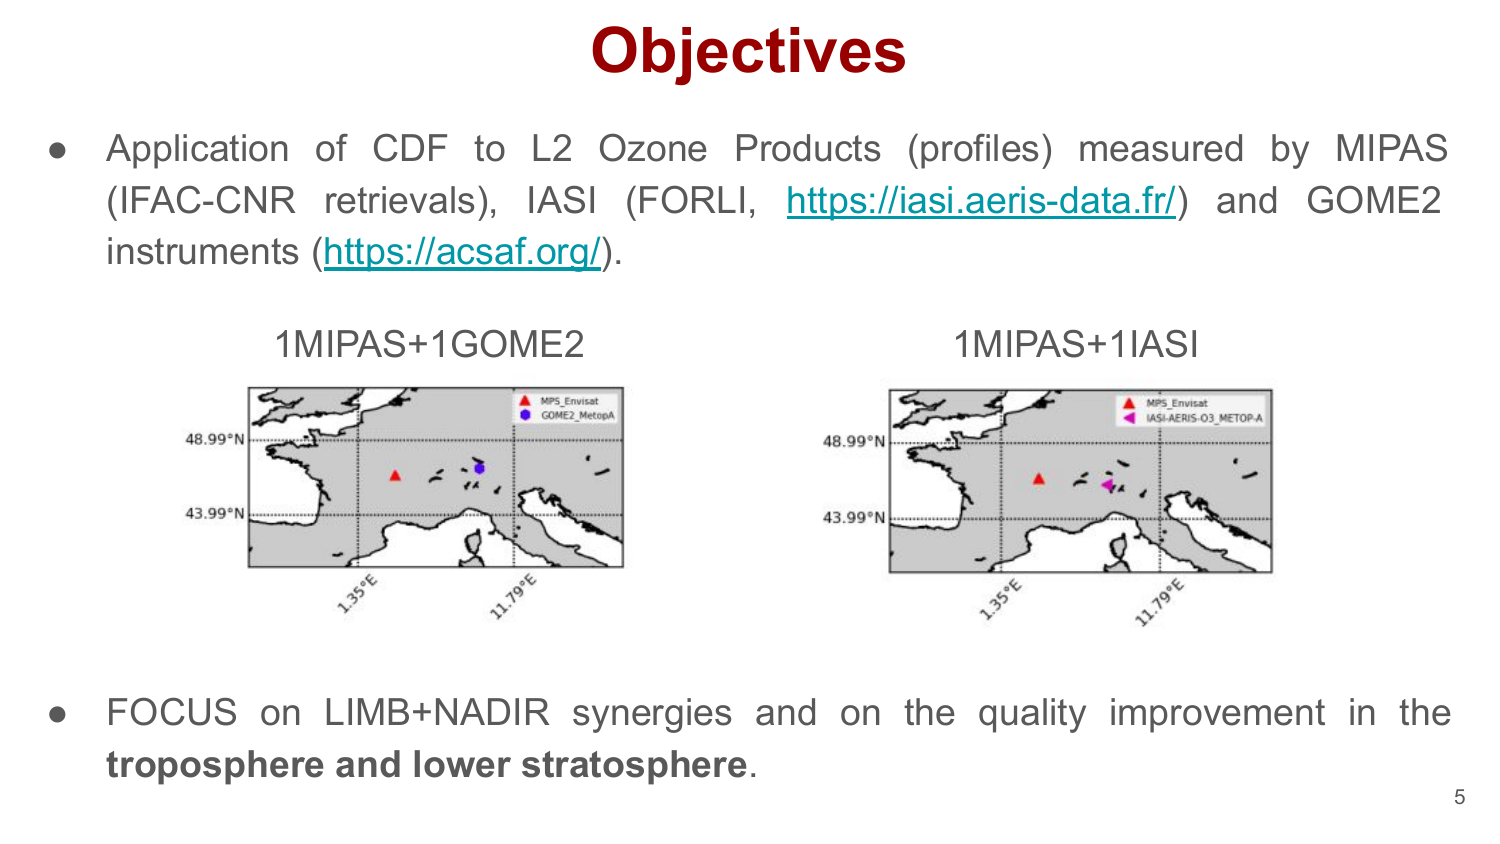
Example of a coincident measurement pair: MIPAS + GOME-2 (left) and MIPAS + IASI (right).
Results: MIPAS+IASI fusion
The MIPAS+IASI fusion was validated against WOUDC ozonesonde measurements (5–55°N, with AK smoothing applied to the reference). In the troposphere and lower stratosphere, the contribution of MIPAS is able to improve the quality of the IASI product even in the vertical region where MIPAS itself does not measure. This is a direct demonstration of the information propagation mechanism in the CDF framework — the same mechanism already observed in the 2021 study through the off-diagonal covariance correlations.
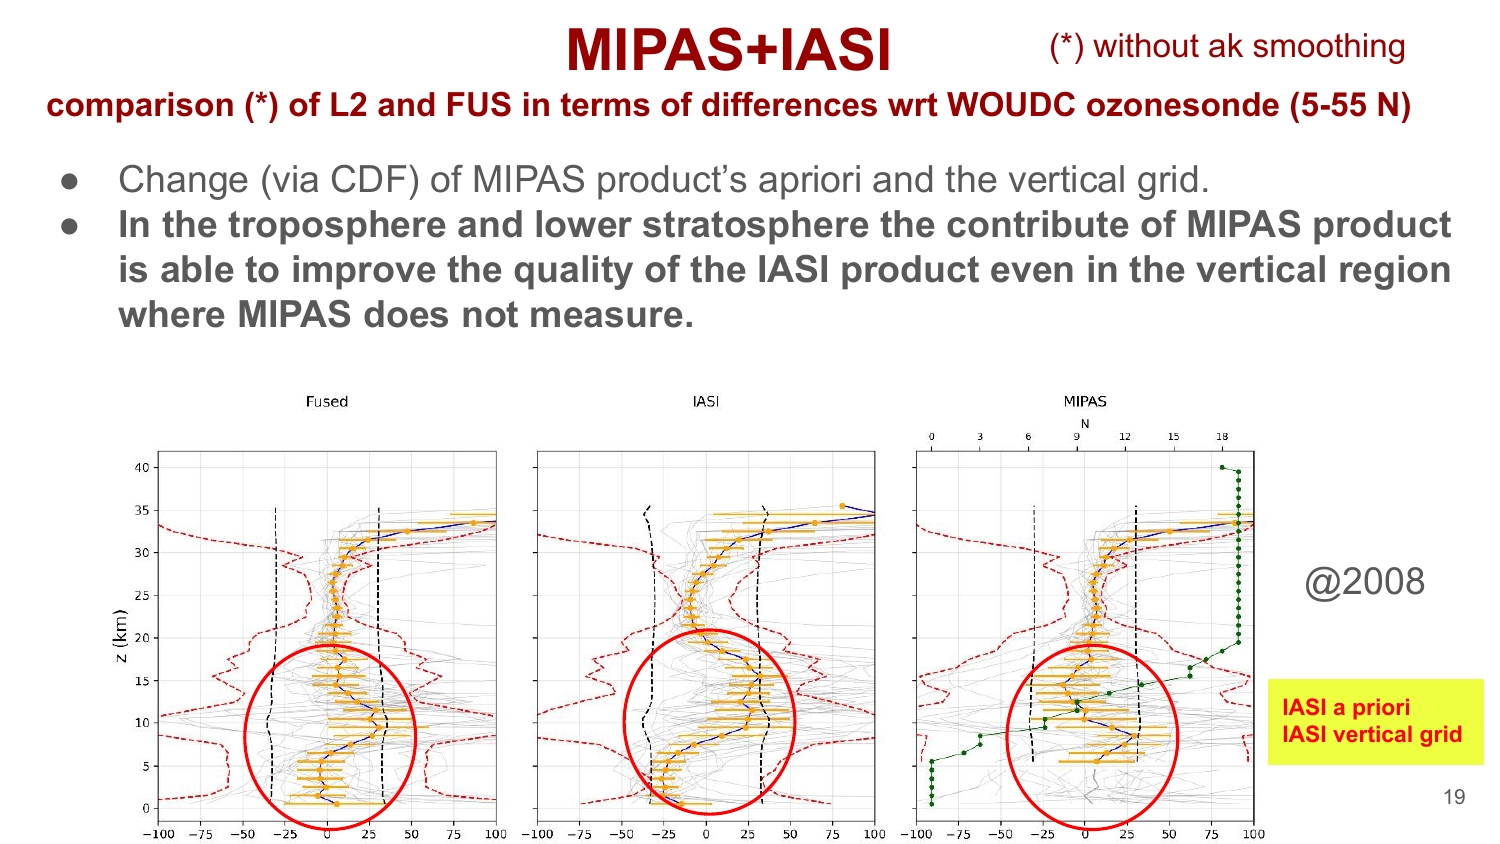
Bias profiles (% vs WOUDC ozonesondes, 5–55°N, 2008) for the fused product, IASI and MIPAS individually. Red circles highlight the troposphere/lower stratosphere region where the MIPAS contribution improves the IASI product.
The validation over 2009–2011 confirms the improvement: the fused product (v05) shows reduced bias and improved DOFs (~3.6 vs ~2.8) in the troposphere/lower stratosphere band.
Comparison: MIPAS+IASI vs MIPAS+GOME-2
When expressed on the same IASI grid with the same a priori, the MIPAS+GOME-2 fusion is very similar to MIPAS+IASI in terms of both profiles and DOFs (~10 for both). On the native GOME-2 grid, MIPAS+GOME-2 achieves ~7 additional DOFs, suggesting that the IASI a priori is more constraining for the GOME-2 product. All fusion configurations show DOFs ↑ and total errors ↓ with respect to the individual input products.
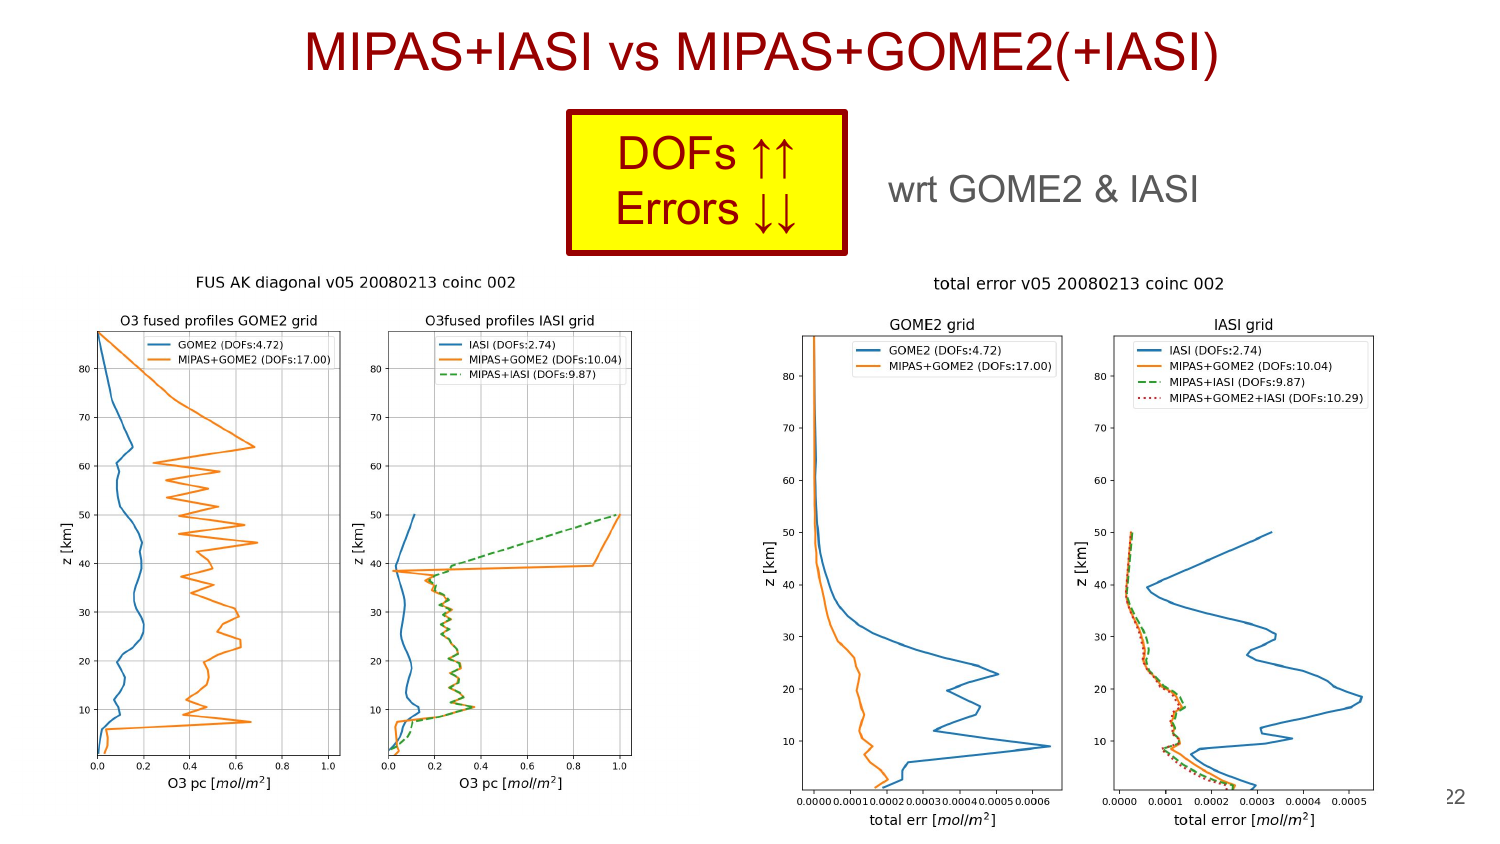
AK diagonal (left) and total error profiles (right) for all configurations on the GOME-2 grid (top) and IASI grid (bottom). All fused products show higher DOFs and lower errors than the individual inputs.
Conclusions and Outlook
Taken together, the two studies document the progressive development of CDF applied to real IASI and GOME-2 ozone data:
- The 2021 case study established that the CDF framework works correctly with both instruments, identified the need for the improved CDF formula (CDF(2022)), and demonstrated the value of the grid-change step for enabling cross-instrument comparisons.
- The 2025 study extended the MIPAS+IASI configuration to a four-year period with full validation against ozonesondes, and carried out a first characterization of the MIPAS+GOME-2 configuration on the same data.
- The MIPAS+IASI dataset is currently being produced at scale in the framework of L. Guidetti’s PhD project (see Guidetti et al., 2026). This is the first systematic CDF ozone dataset derived from real satellite observations.
Future developments planned from the 2025 study include:
- Detailed study of MIPAS+GOME-2 (dedicated tuning of coincidence/interpolation error strategies, validation vs ozonesonde, comparable to the work done for MIPAS+IASI)
- A gridded MIPAS+IASI+GOME-2 product at 1°×1° resolution covering 2008–2011, combining the vertical resolution of MIPAS with the complementary nadir coverage of both IASI and GOME-2
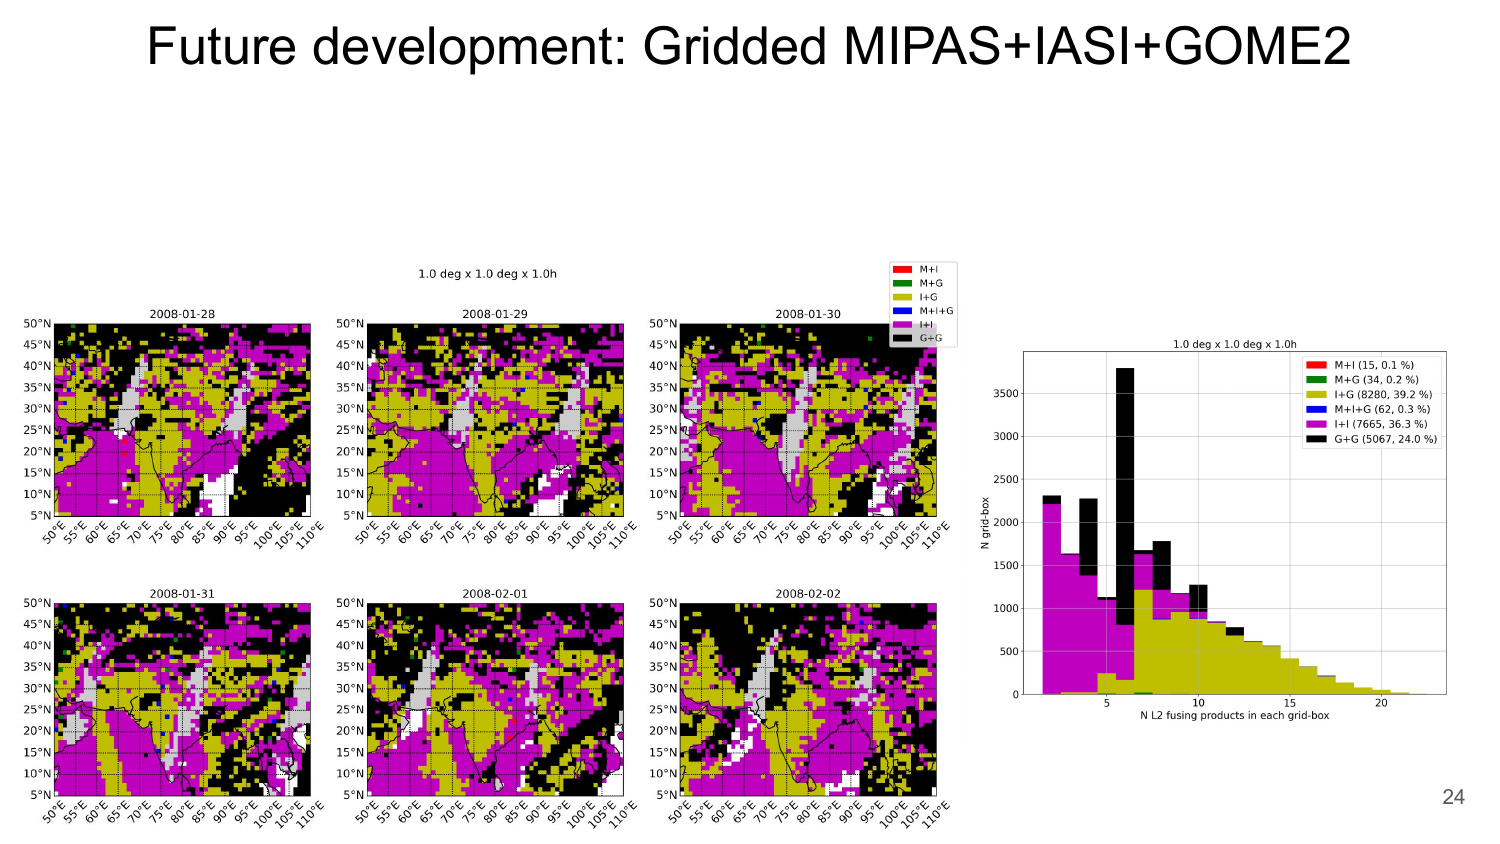
Daily coverage maps (1°×1°×1h grid) for a representative week in January–February 2008, showing which instrument combinations are available in each grid cell. The histogram (right) shows the distribution of the number of L2 products per grid box.
The extended MIPAS+IASI (1+1) dataset (4 yrs), currently in production, will be described once available in the CDF Datasets section.